-
Your shopping cart is empty!
MENU
Your shopping cart is empty!
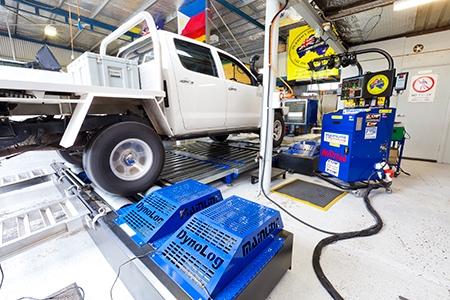
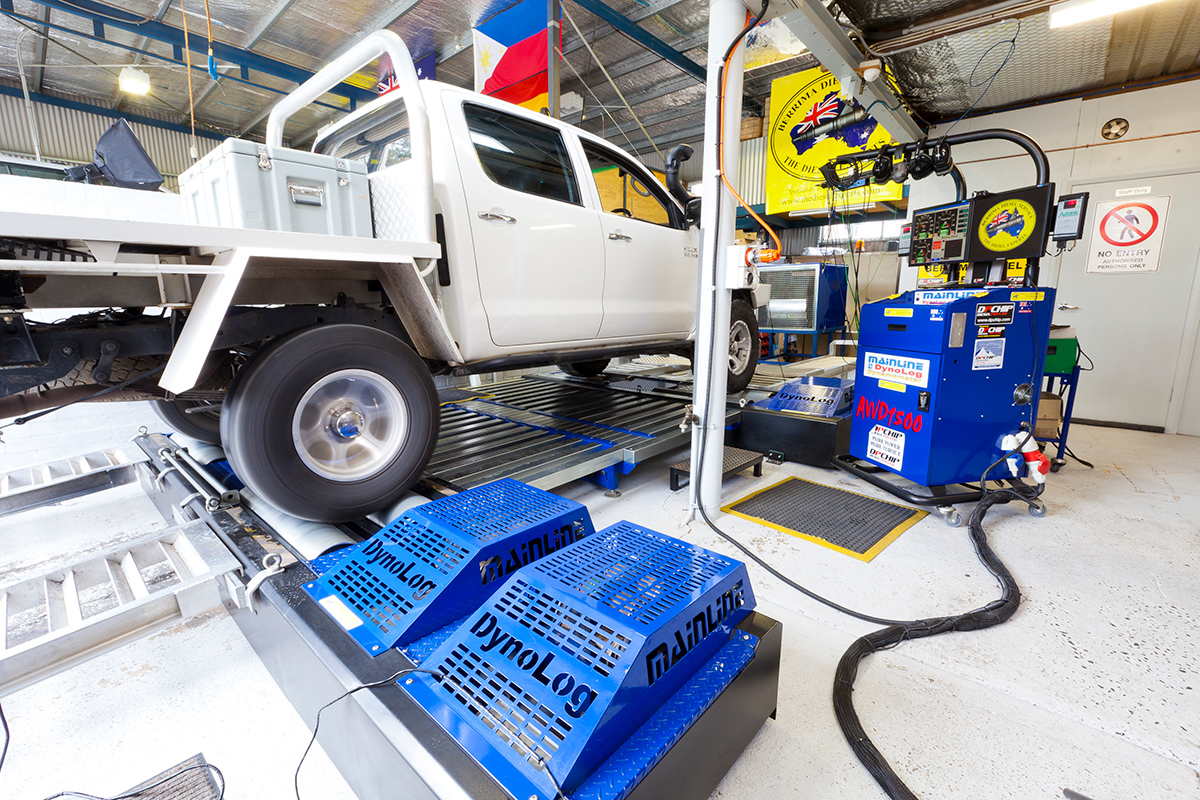
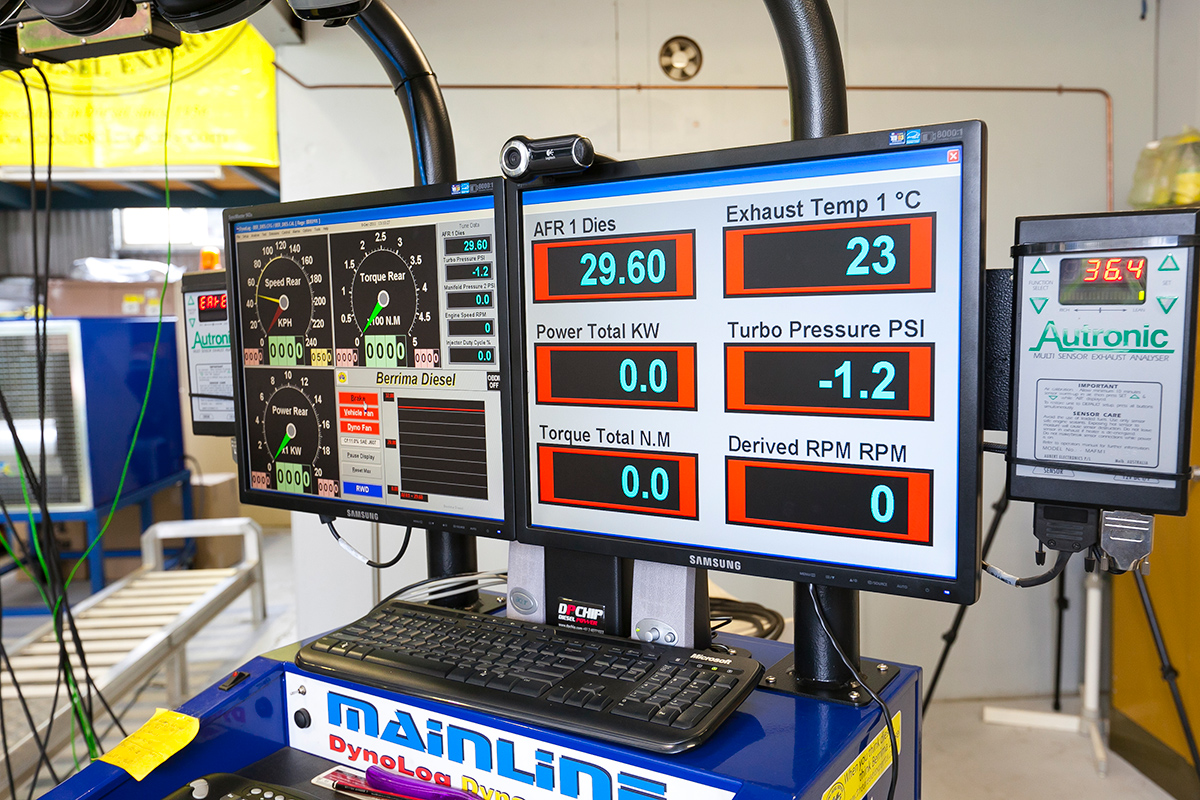
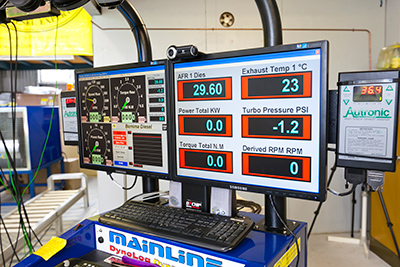
Our mainline 4wd Dyno can log up to:
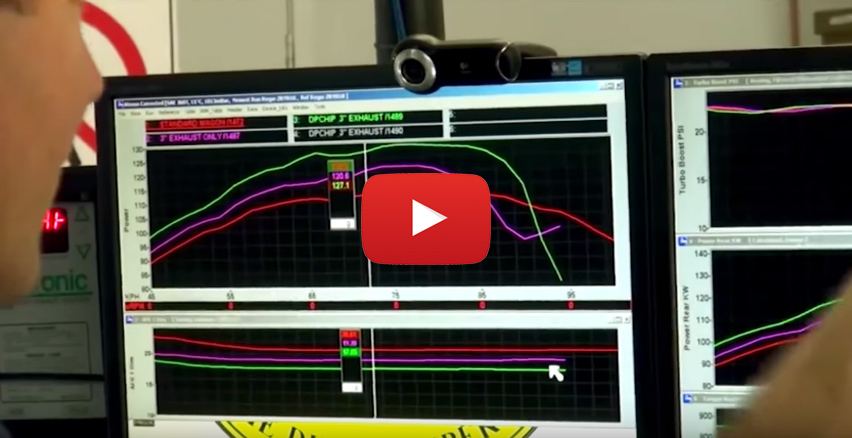
With just a few dyno runs we can show you clearly the power and torque gains and the improvements made to your vehicle. The results are there for all to see. It also allows us to diagnose and solve problems that others can’t.
- Log up to 16 thermocouples
- 8 Lambda/AFR probes
- Multiple MAP sensors
- Water temperature
- Oil pressure
- Oil temperature
- Fuel pressure
- Fuel flow
- Differential fuel flow
- OBD – II data
- ECU Data
- Gas Analysers
- Diesel Opacity
- And much more.
HOW ACCURATE ARE DYNO RESULTS?
There is much deliberation around the industry about dyno accuracy. Just how accurate are the dyno power readings? Why does the same car get different results on different days? Why does the same car get different results on dynos from the same manufacturer and from different manufacturers? One needs only to peruse some of the “forums” on the internet to see that there can be significant differences in the results produced by the same vehicle when run on different brand dynos and even on the same brand of dyno. But some people say that the accuracy of a dyno is not as important as its ability to reflect the outcome when modifications are made to a vehicle, and its repeatability. Others say a dyno is only useful as a tuning tool and does not need to be relied upon to be accurate. Is it any wonder people get confused. Read on to get an understanding of the reasons behind the variations in results.
TOnce upon a time, there were really only 3 key reasons why a vehicle could show a different power reading on the same Dyno at different periods in time, they are:
- The Dyno was not correctly calibrated
- The Atmospheric (Weather)Conditions had changed
- The Vehicle had a problem that affected its Power Output.
TEarly chassis dynos were only able to apply load, and subsequent models were extended to measure some basic outputs like torque, power and speed. The dyno operator had little influence over the dyno and had to accept the results that the dyno produced. Now, would it not follow that if the vehicle was unchanged and weather conditions were constant, that one vehicle could be expected to produce at least similar results on several of the same brand of dyno, or all dynos for that matter? Is incorrect calibration likely to be a factor? Perhaps, but with modern dyno hardware, a dyno is not likely to lose calibration through normal use. Dynos that are available these days have mostly evolved into state-of-the-art diagnostic tools and keep pace with the high-tech advances in motor vehicle technology. The better quality dynos can now generate vehicle specific information and a level of accuracy that was not conceivable even a few years ago. Faster computers and the flexibility of the Microsoft Windows operating system have given dyno programmers a far more powerful tool than they have ever had before. So what other factors are involved? We would surely all agree that any dyno manufacturer worth their salt is interested in producing accurate and honest results from their dyno. An intrinsic part of producing accurate, honest and consistent results from a dyno requires that the dyno dictates the power produced by a vehicle without undue influence from the dyno operator. Let’s look at how results can be influenced.

THE DYNO OPERATOR
The evolved dyno operator of today has much greater influence over the results produced on a dyno than ever before, and the dyno operator has become another reason why a vehicle can show different power readings on the same dyno at different periods of time. Is it possible that at least some operators would mislead a customer about the extra power produced by an aftermarket add-on or a performance tune if they were able to do that? In a market place where more power seems to be better, would it be in a dyno operator’s interest to satisfy a vehicle owner’s desire for high power figures? Many dyno manufacturers have ensured that the “operator factor” is eliminated as far as possible, meaning that they lock the operator out of areas of the dyno controller where results can be “influenced” and follow a policy where all relevant dyno run factors are displayed on run files and printouts so that any attempt that has been made to manipulate the results can be easily identified. But not all dyno manufacturers have taken that approach. At least one brand of dyno has built in an easily accessible “correction factor” that the dyno operator can use to increase or decrease the results produced, and so, for example, in the hands of an unscrupulous operator, the “correction factor” could be used to mislead a customer about extra performance when no performance benefit was actually achieved. It could also be used to convince a vehicle owner that a vehicle generates far more power than it is capable of.
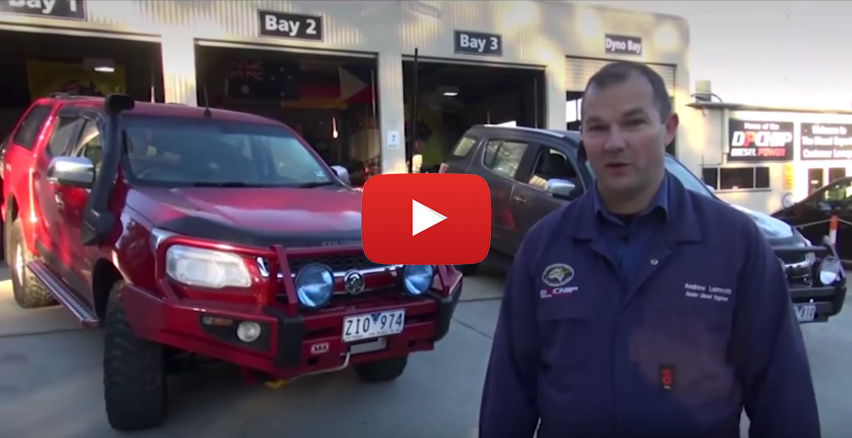
One vehicle dyno tuned at Berrima Diesel
Power and Torque upgrades for Holden Colorados part1
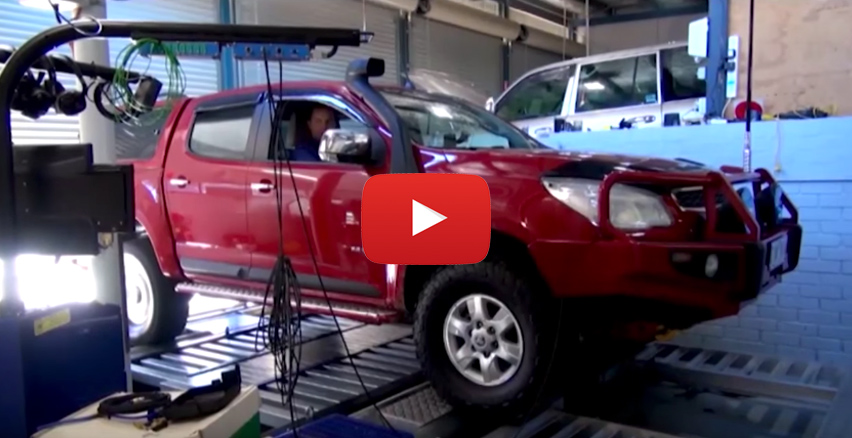
Power and Torque upgrades for Holden Colorados part2
Power and Torque upgrades for Holden Colorados part3
VEHICLE INERTIA FACTORING
Another example of why sometimes people get curious dyno results from different dyno brands is because one dyno manufacturer may attempt to factor in Vehicle Inertia while another may not. Vehicle inertia is best explained as this. If you are accelerating a car, then part of the torque produced is consumed to accelerate all of the rotating components of the car, ie Wheel/Tyres, Driveshafts, Gears etc. This is not Driveline Loss, Driveline Loss is the friction generated from gears, bearings, universal joints and Tyre to Roller contact. There is nothing wrong with trying to account for vehicle inertia, provided it is used correctly.
The problem with applying vehicle inertia is that not every car is the same. For example, if you were to change from 16” Rims to 19” Rims on a car, you have effectively changed the vehicle inertia, because with inertia the further the mass is from the centre of a rotating object, the more inertia there is. So on a dyno that uses vehicle inertia correction, an operator may specify an inertia value for a vehicle.
BELOW ARE SOME RESULTS FROM VARIOUS VEHICLES RUN ON OUR DYNO
These figures are true engine power results unlike some other dyno operators who can get big horsepower numbers by running the vehicle in 2nd gear we run the vehicle in 4th gear (as close to 1:1 as possible) so that we are actually measuring the real engine power. Be cautious of dyno operators who run in lower gears and always ask them ‘Why?’ Some customers are disappointed or surprised at the results on our dyno claiming they have achieved better figures on another dyno. Our reply to this is; ‘Our dyno doesn’t lie. We can also show you big horsepower figures to massage your ego if that’s all you want to see but we would prefer to give you the real engine power results of your vehicle.’ Honesty and integrity are the foundation of our business.
- All
- Ford
- Holden
- Isuzu
- Mazda
- Mitsubishi
- Nissan
- Subaru
- Toyota
- Volkswagen
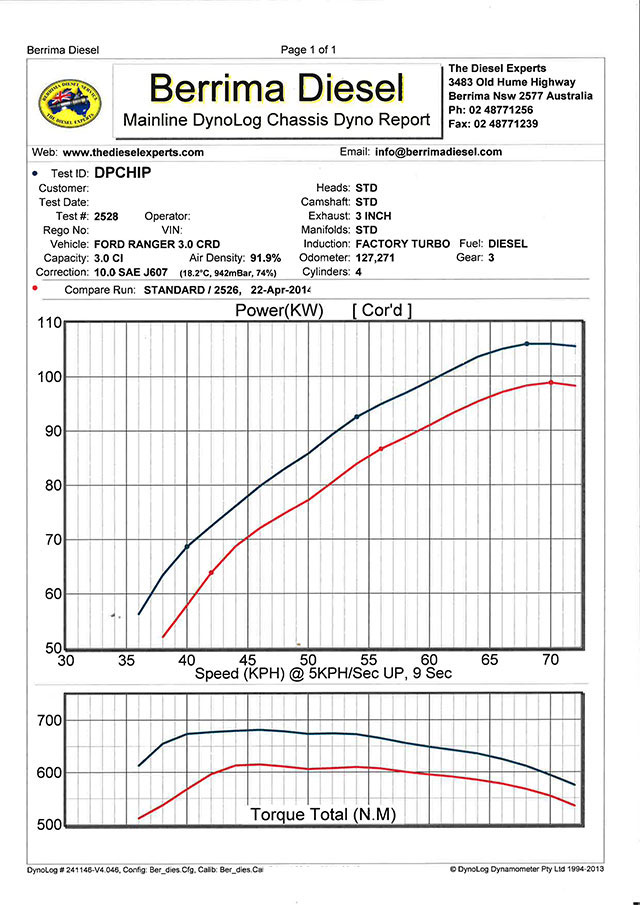
FORD RANGER 3.0L CRD
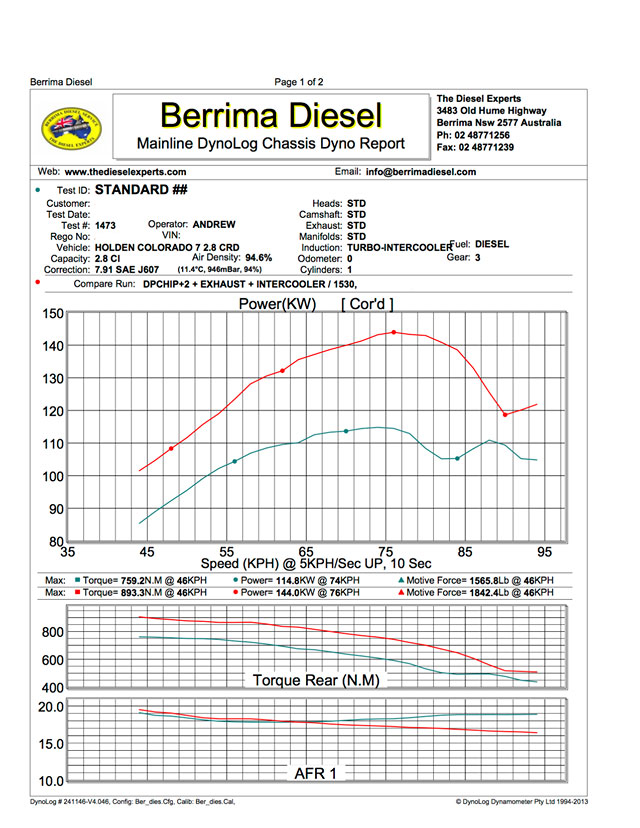
HOLDEN COLORADO 7 2.8L CRD CHIP EXHAUST INTERCOOLER
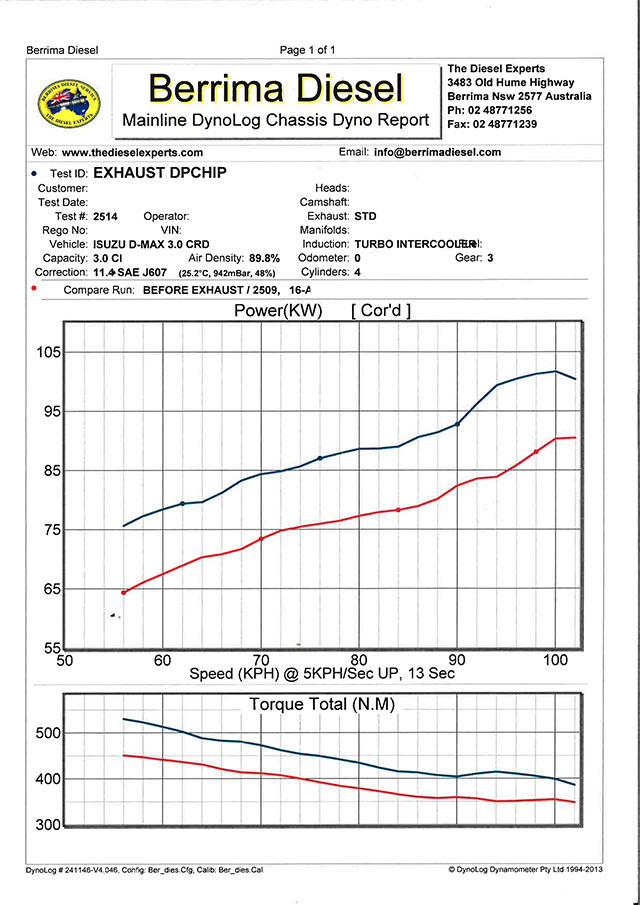
ISUZU D-MAX 3.0L EXHAUST & DPCHIP
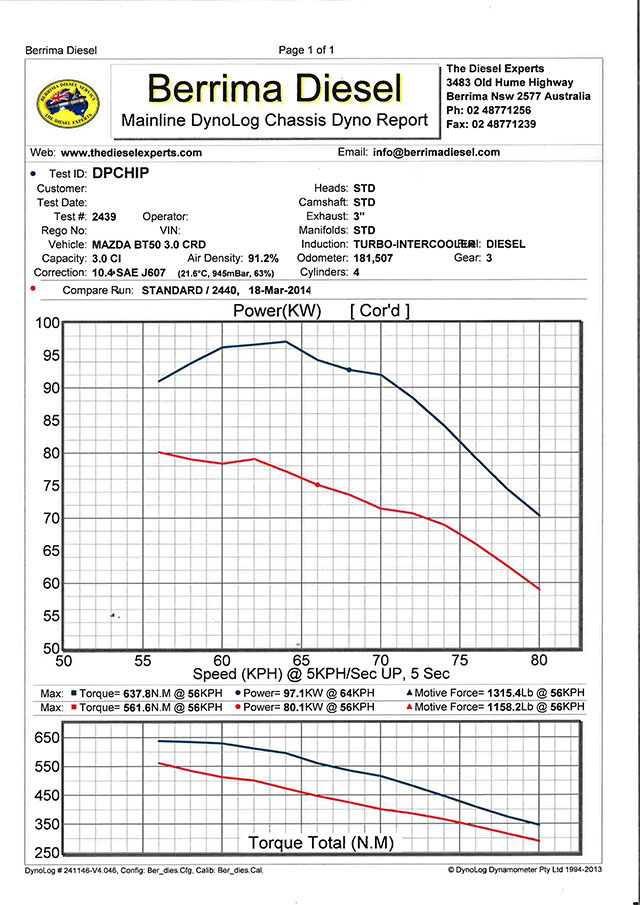
MAZDA BT50 3.0L CRD DPCHIP
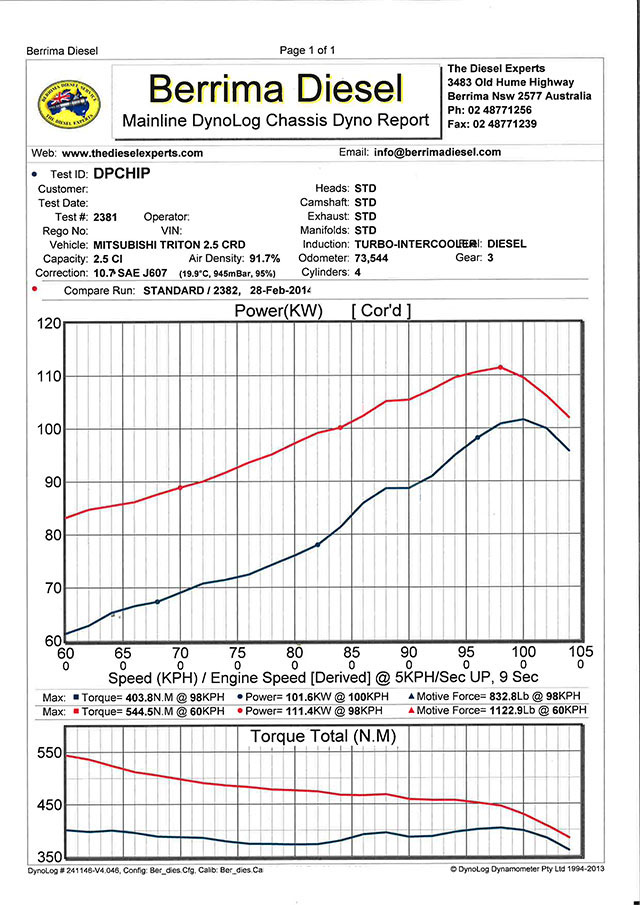
MITSUBISHI TRITON 2.5L CRD DPCHIP
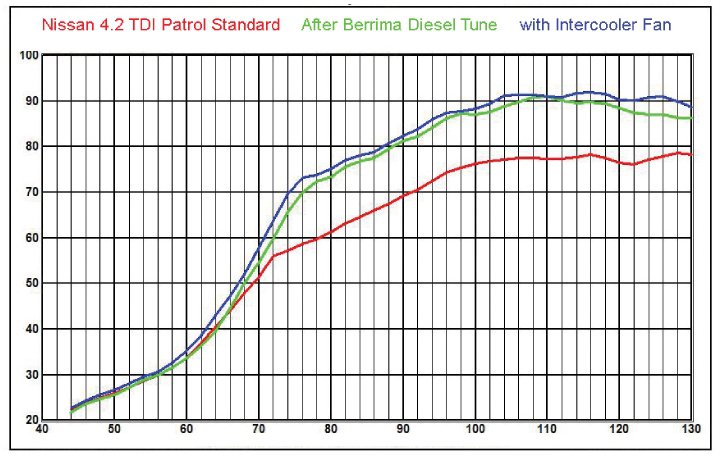
NISSAN 4.2 TDI PATROL STANDARD
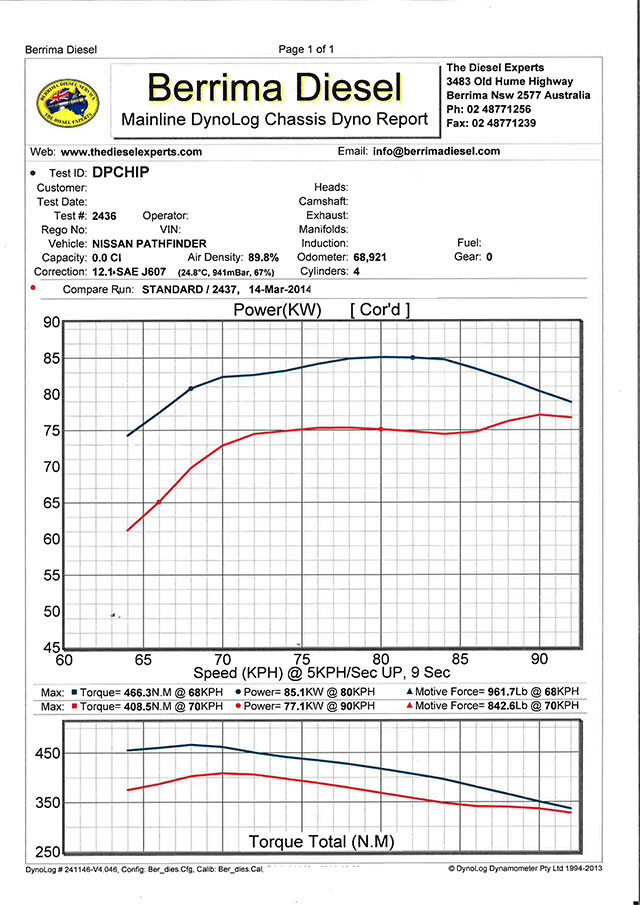
NISSAN PATHFINDER DPCHIP
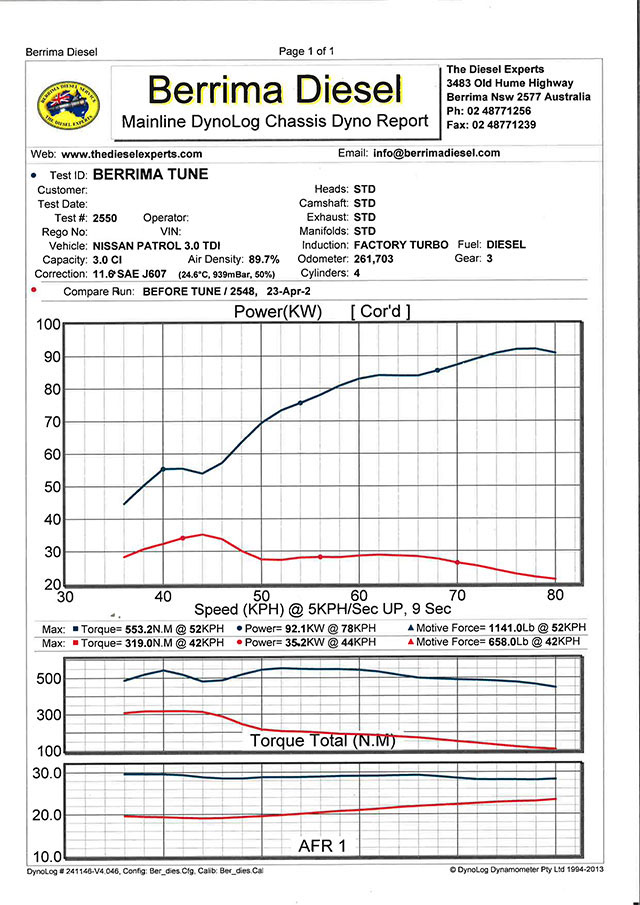
NISSAN PATROL 3.0L TDI TUNING
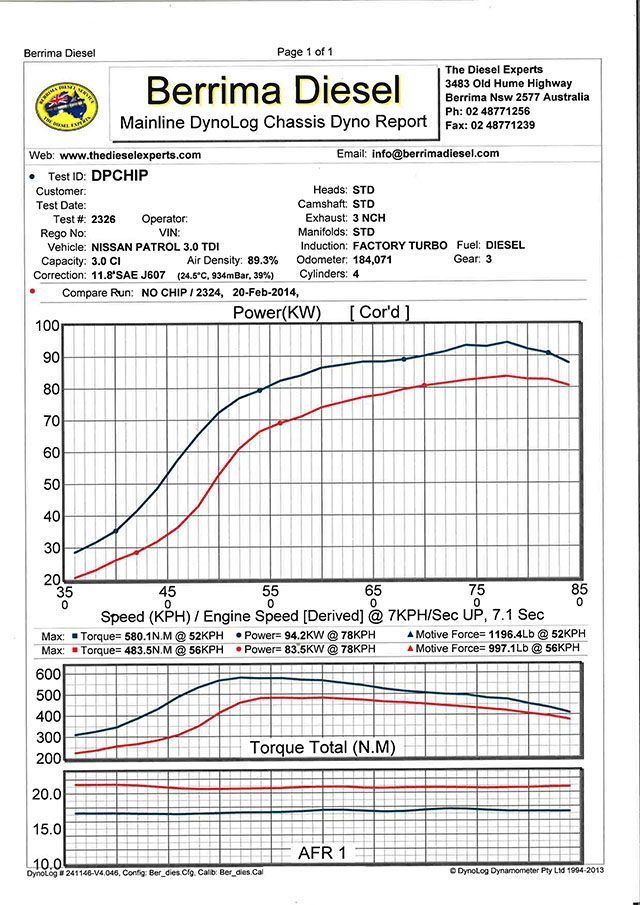
NISSAN PATROL 3.0L TDI DPCHIP
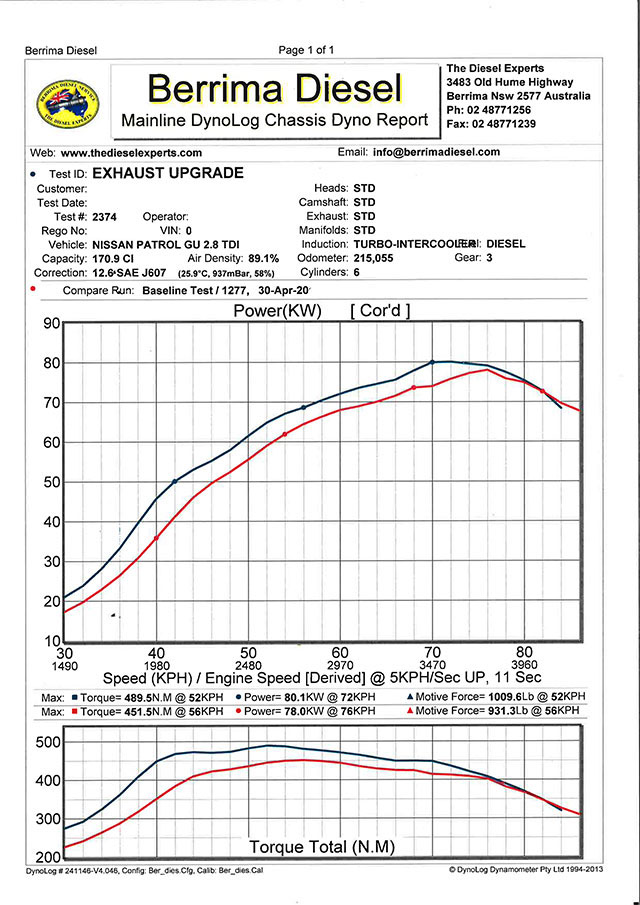
NISSAN PATROL GU 2.8L TDI EXHAUST UPGRADE
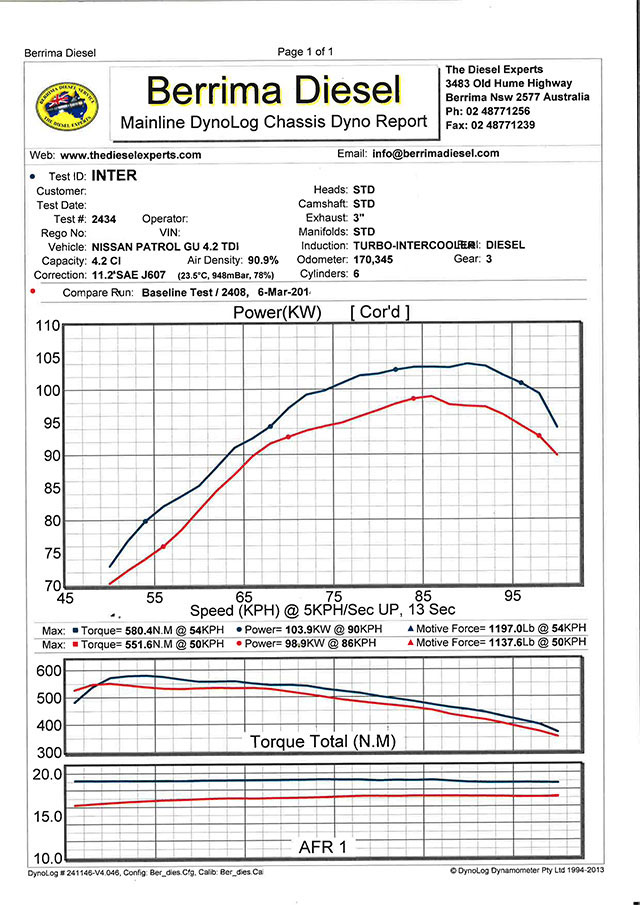
NISSAN PATROL GU 4.2L TDI INTERCOOLER
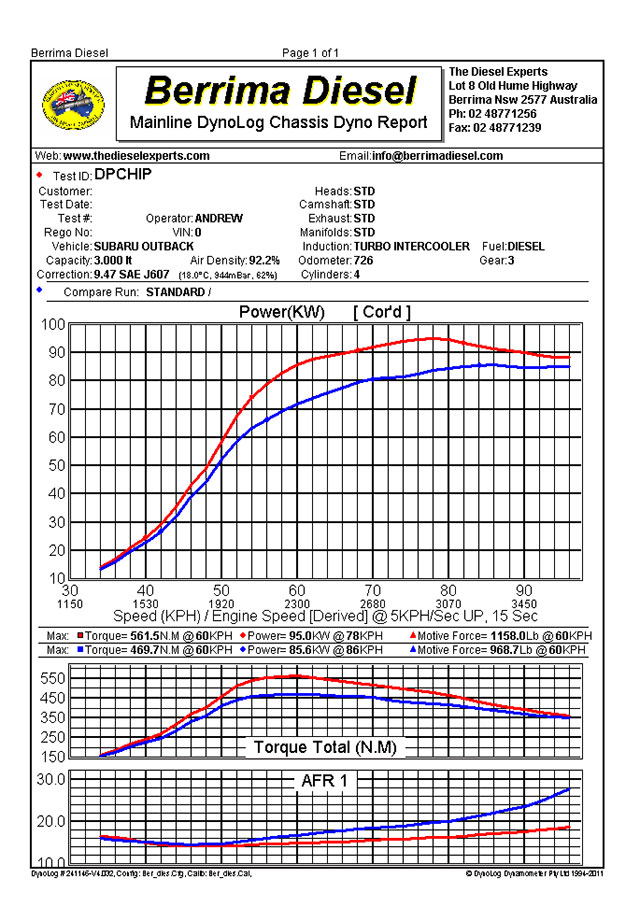
AFRS OF SUBARU
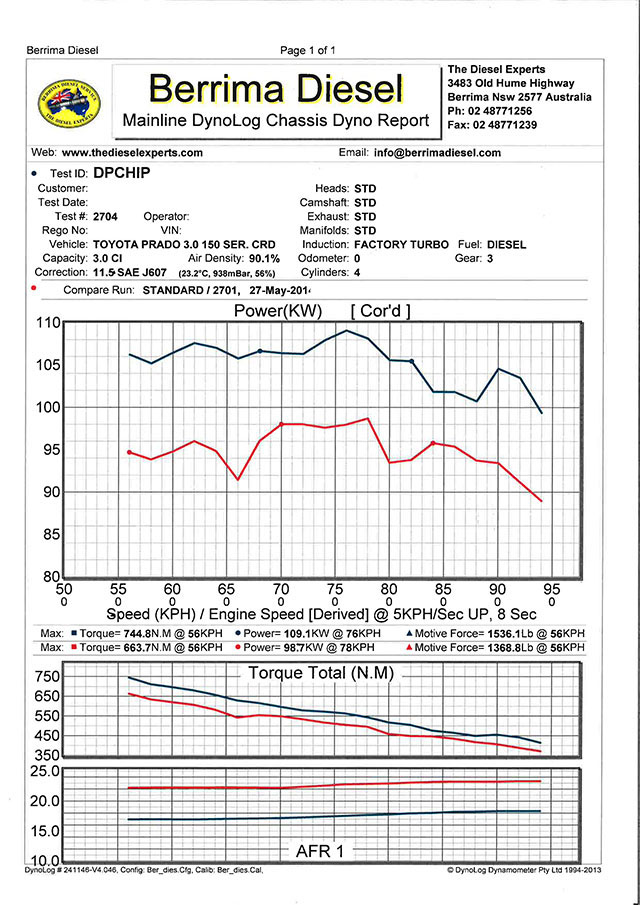
TOYOTA PRADO 150 SERIES CRD
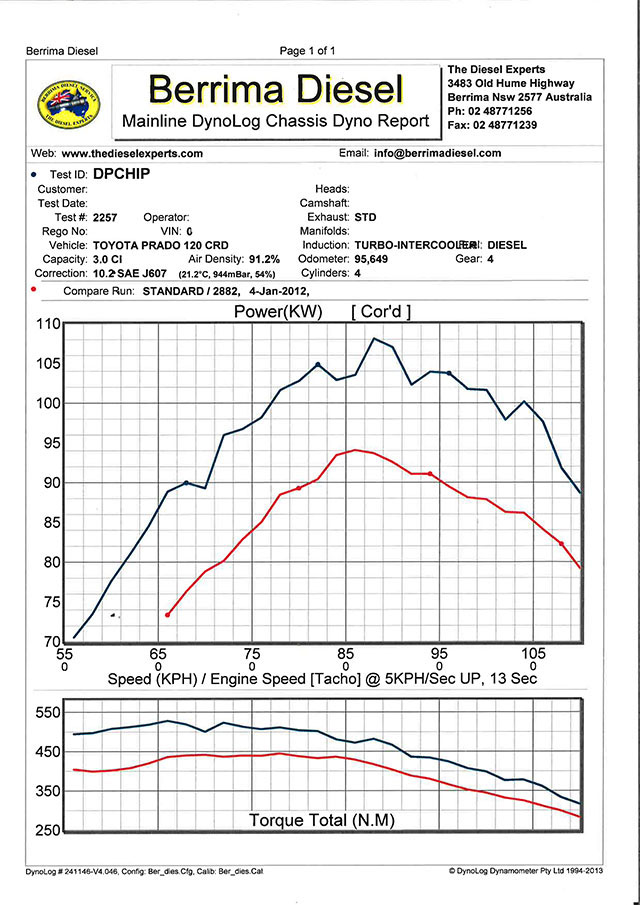
TOYOTA PRADO 120 SERIES CRD
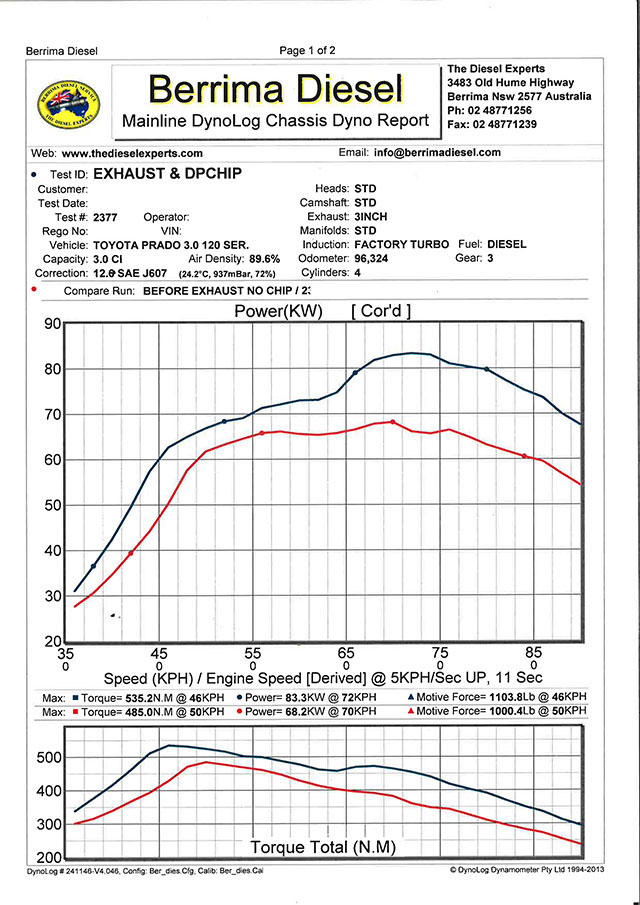
TOYOTA PRADO 3.0L 120 SERIES
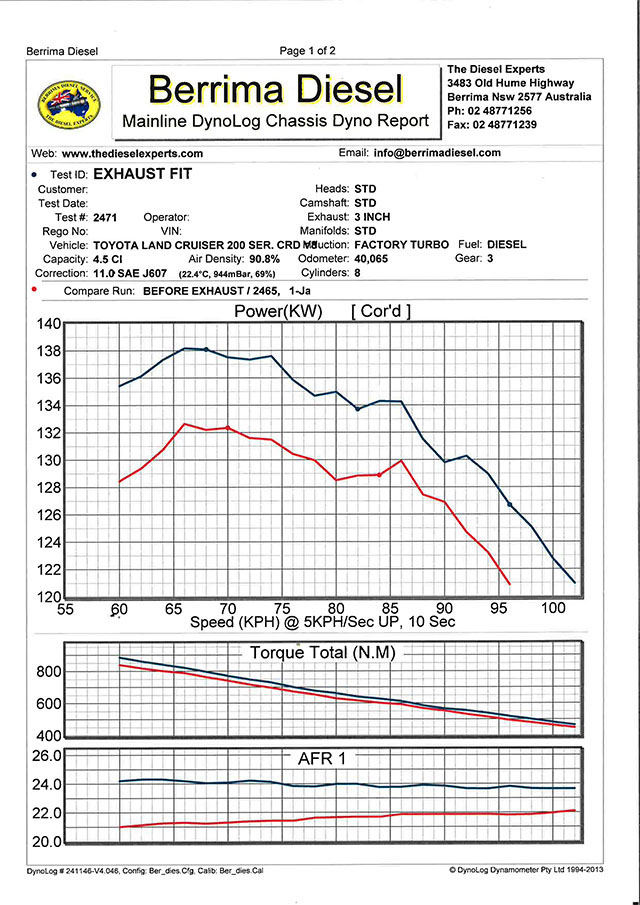
TOYOTA LANDCRUISER 200 SERIES CRD
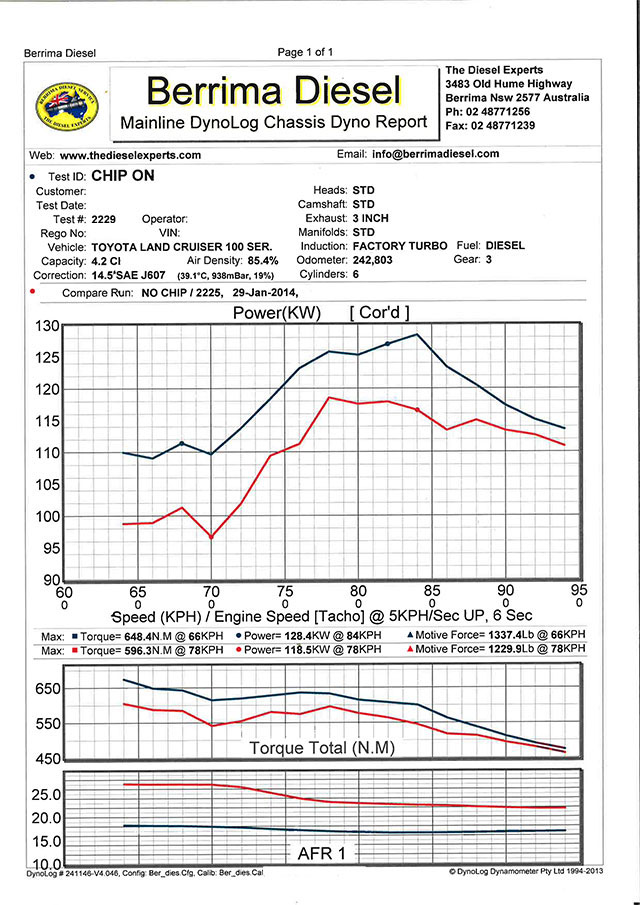
TOYOTA LANDCRUISER 100 SERIES
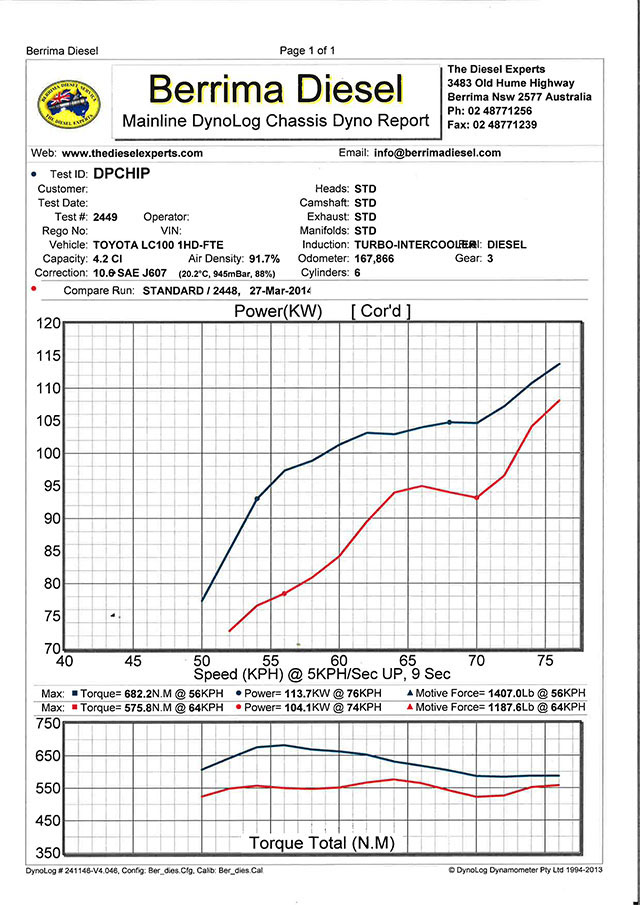
TOYOTA LANDCRUISER 100SERIES 1HD-FTE
TOYOTA LANDCRUISER 70 SERIES V8
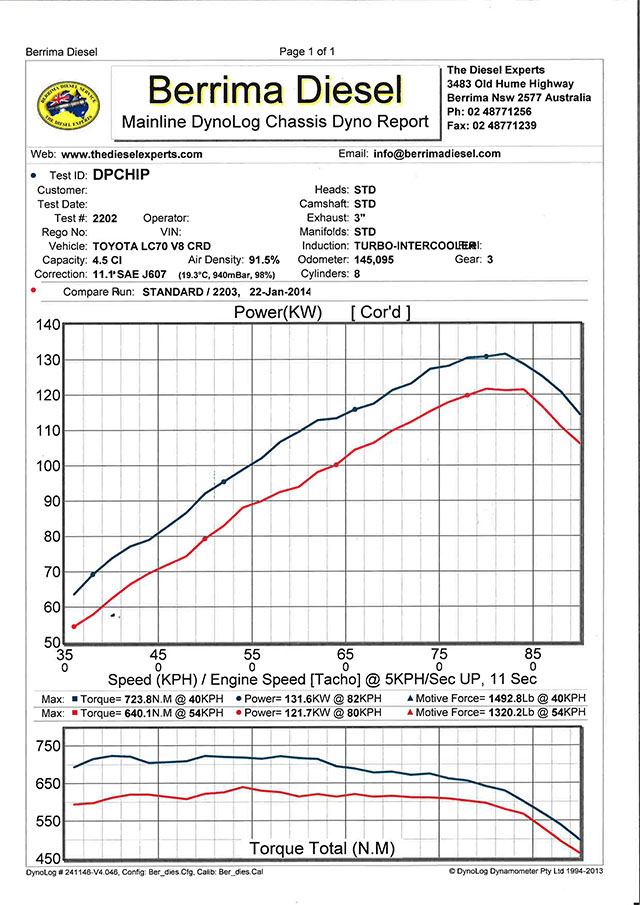
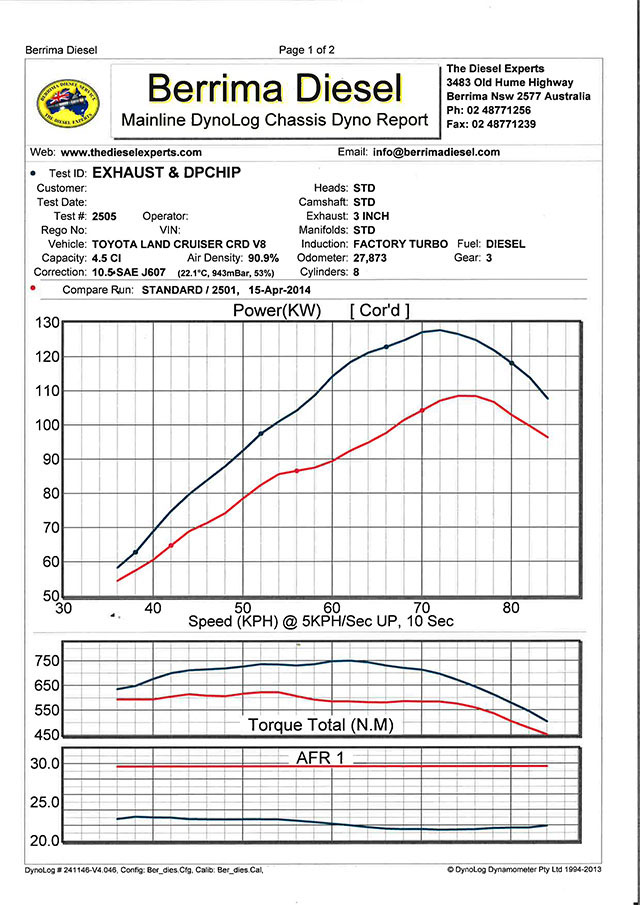
TOYOTA LANDCRUISER CRD V8
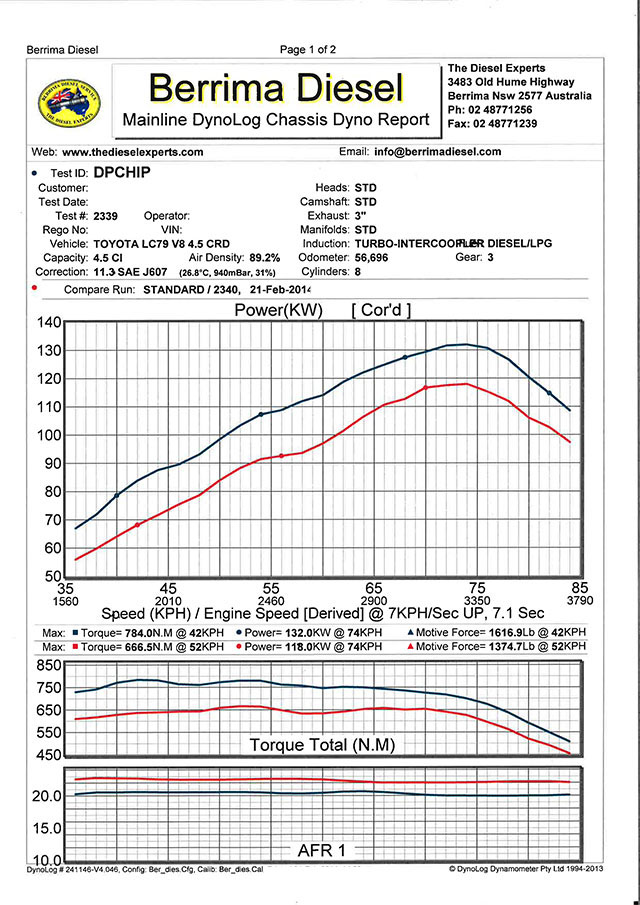
TOYOTA LANDCRUISER 79 SERIES V8 4.5L CRD DPCHIP
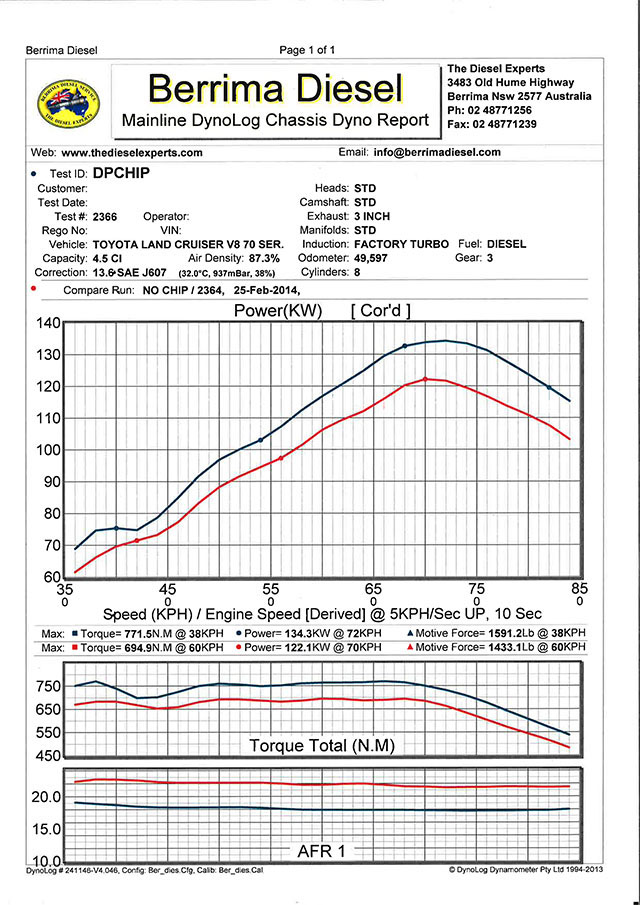
TOYOTA LANDCRUISER 70 SERIES V8 DPCHIP
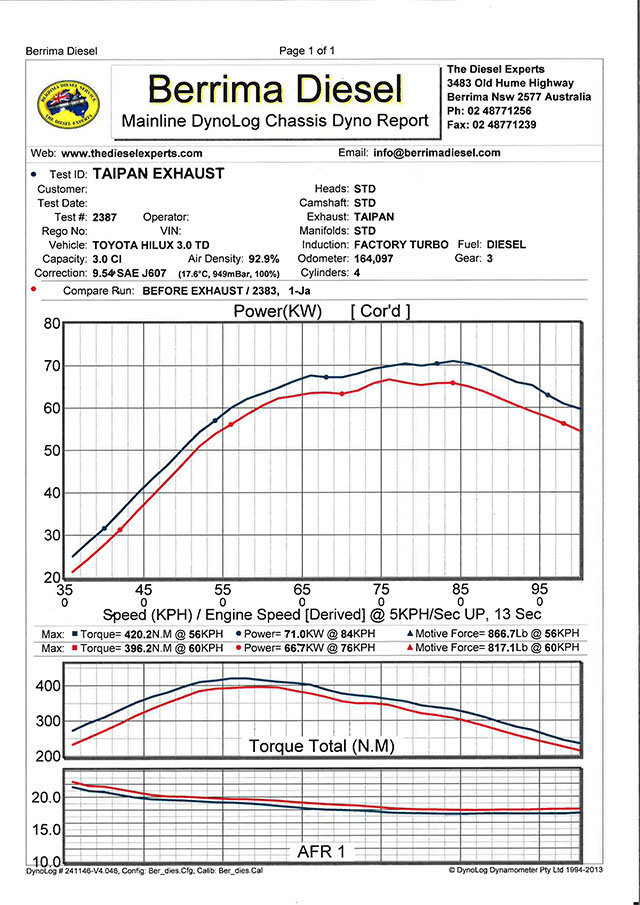
TOYOTA HULIX 3.0L TD TAIPAN EXHAUST
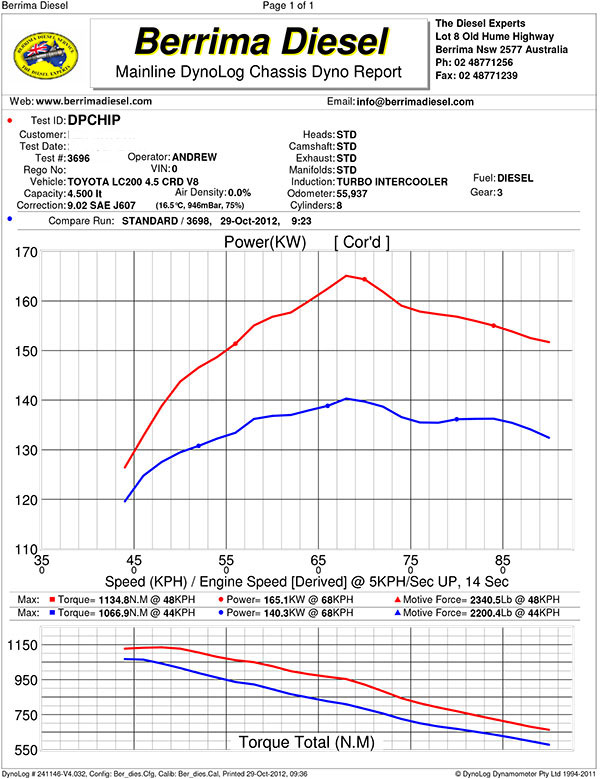
TOYOTA LANDCRUISER 200 4.5 V8 CRD
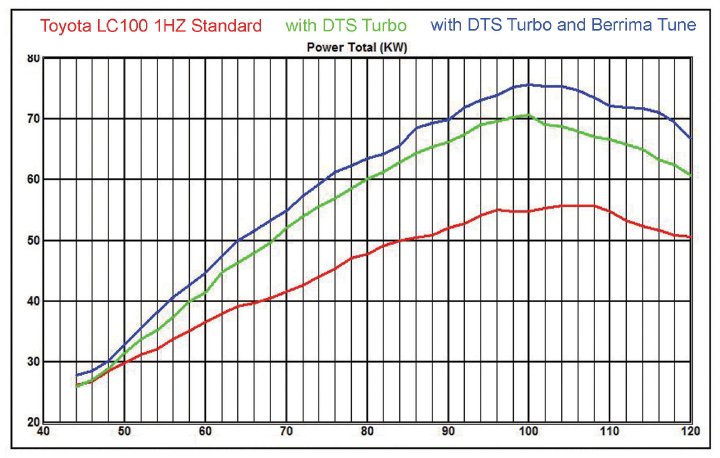
TOYOTA LC 100 1HZ STANDARD
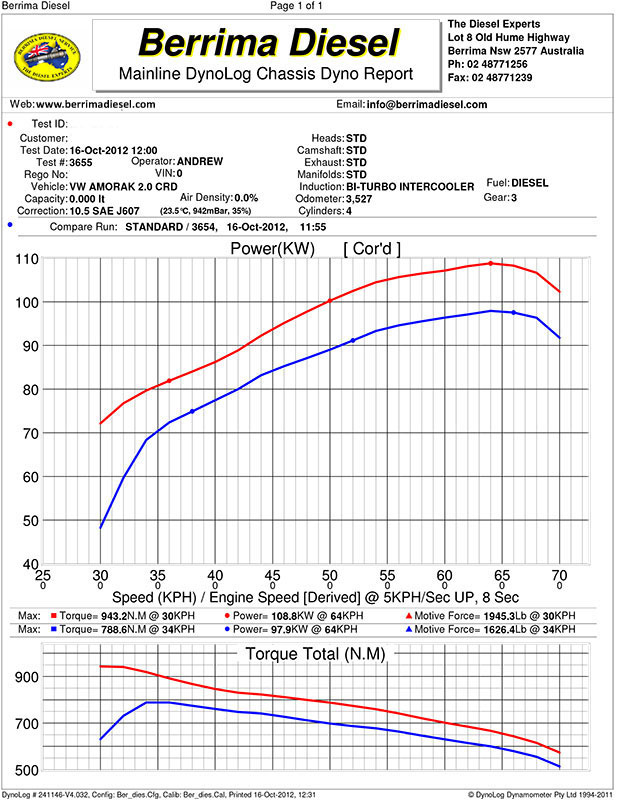
VW AMAROK 2.0 CRD 10-12
ATMOSPHERIC CORRECTION
Modern dynos also have the ability to correct power on the basis of changes to weather conditions. A short explanation is needed here to fully understand atmospheric correction. Atmospheric correction is applied to compensate for changes to the combustive properties of the ambient air (the quantity of oxygen per unit volume) in an attempt to provide a level playing field between dyno runs. Atmospheric Correction Standards are defined by organisations such as SAE, ISO, DIN, ECE etc and each uses a slightly different way of measuring change. Using the widely accepted SAE J607 standard, on an ideal day when the temperature is 15 degrees Celsius, and there is 0% humidity, and the Barometric Pressure is 1015mbar, zero power correction is applied. Variations in any of these three atmospheric factors will either cause positive or negative power correction to be applied. If the temperature changed to say 19 degrees Celsius, the humidity to 34% and the Barometric Pressure to 989mbar, the conditions are not as ideal and the vehicle will not make as much power. By applying the SAE J607 atmospheric correction (in this case +3.89%), the power readings are corrected to what the vehicle could be expected to make on an “ideal” day. The amount of power correction applied to a vehicle always needs to be an accurate reflection of how much power is actually lost by or gained by the vehicle as a result of unfavourable weather conditions. The SAE J607 standard specifies a maximum ceiling of 10% power correction, on the basis that any power correction in excess of 10% will produce a power figure that cannot necessarily be reproduced by the vehicle under optimum conditions.
So, a dyno that can accurately correct vehicle power according to changed weather conditions should produce more consistent and accurate results from run to run. A dyno that cannot correct vehicle power according to weather conditions or where weather conditions have not been regularly updated can produce results that vary considerably from run to run. A 5ºC inaccuracy in air temperature can lead to a 0.9% change in power figures. A 3 mBar (normal range 900 to 1050 mBar) inaccuracy in barometric pressure give a 1% change in power.